ELK STACK INSTALLATION ON UBUNTU 14.04
Our Goal:
The goal of the Document is to set up Logstash to gather syslogs of multiple servers, and set up Kibana to visualize the gathered logs.
Our ELK stack setup has four main components:
- Logstash: The server component of Logstash that processes incoming logs
- Elasticsearch: Stores all of the logs
- Kibana: Web interface for searching and visualizing logs, which will be proxied through Nginx
- File Beat: Installed on client servers that will send their logs to Logstash, File Beat serves as a log shipping agent that utilizes the lumberjack networking protocol to communicate with Logstash

We will install the first three components on a single server, which we will refer to as our ELK Server. Filebeat will be installed on all of the client servers that we want to gather logs for, which we will refer to collectively as our Client Servers.
Prerequisites
- OS: Ubuntu 14.04
- RAM: 4GB
- CPU: 2
Install Java 8
Elasticsearch and Logstash require Java.
sudo add-apt-repository -y ppa:webupd8team/java
sudo apt-get update
sudo apt-get -y install oracle-java8-installer
Install Elasticsearch
Run the following command to import the Elasticsearch public GPG key into apt:
wget -qO - https://packages.elastic.co/GPG-KEY-elasticsearch | sudo apt-key add -
Create the Elasticsearch source list:
echo "deb http://packages.elastic.co/elasticsearch/2.x/debian stable main" | sudo tee -a /etc/apt/sources.list.d/elasticsearch-2.x.list
sudo apt-get update
Install Elasticsearch with this command:
- sudo apt-get -y install elasticsearch
Error:
Elasticsearch doesn’t install because the package is not present in it.so download elasstic search 2.X.dep in your browser and place that package into an appropriate location.
After installed elasticsearch:
sudo service elasticsearch restart
sudo update-rc.d elasticsearch defaults 95 10
sudo update-rc.d elasticsearch defaults 95 10
Check response: Curl - X GET http://localhost:9200
Install Logstash
echo 'deb http://packages.elastic.co/logstash/2.2/debian stable main' | sudo tee /etc/apt/sources.list.d/logstash-2.2.x.list
sudo apt-get update
sudo apt-get install logstash
sudo service logstash restart
sudo update-rc.d logstash defaults 96 9
sudo apt-get update
sudo apt-get install logstash
sudo service logstash restart
sudo update-rc.d logstash defaults 96 9
Install Kibana
sudo apt-get install apache2 -y
sudo service apache restart
sudo apt-get update
Tar -zxvf kibana-4.5.0-linux-x64.tar.gz
Sudo mkdir -p /var/www/kibana
Copy folder and rename:
Config kibana web server:
Sudo gedit /etc/apache2/conf-enabled/kibana.conf
Alias /kibana /var/www/kibana
<Directory /var/www/kibana>
Order allow,deny
Allow from all
<Directory>
Restart apache2
Sudo service apache2 restart
Sudo service kibana start
Sudo update-rc.d kibana defaults 96 9
It shows an output screen:

Errors:
If the status shows a warning on plugin elasticsearch : kibana index is not found.
Run the below coding in a terminal:
curl -XPUT http://localhost:9200/shakespeare -d '
{
"mappings" : {
"_default_" : {
"properties" : {
"speaker" : {"type": "string", "index" : "not_analyzed" },
"play_name" : {"type": "string", "index" : "not_analyzed" },
"line_id" : { "type" : "integer" },
"speech_number" : { "type" : "integer" }
}
}
}
}
{
"mappings" : {
"_default_" : {
"properties" : {
"speaker" : {"type": "string", "index" : "not_analyzed" },
"play_name" : {"type": "string", "index" : "not_analyzed" },
"line_id" : { "type" : "integer" },
"speech_number" : { "type" : "integer" }
}
}
}
}
curl -XPUT localhost:9200/_bulk --data-binary @shakespeare.json
Next
@elk:# gedit /etc/logstash/conf.d/beats-input.conf
In that change
type => “syslogs”
And command ssl_certificate and ssl_key
# ssl_certificate
#ssl_key
Save and quit.
In a client mechine:
open the terminal and go to root :
$sudo su
Password:
Sudo dpkg -i filebeat_1.2.3_amd64.dep
On Client Server, create and edit Filebeat configuration file:
sudo vi /etc/filebeat/filebeat.yml
Near the top of the file, you will see the prospectors section, which is where you can define prospectors that specify which log files should be shipped and how they should be handled. Each prospector is indicated by the - character.
We'll modify the existing prospector to send syslog and auth.log to Logstash. Under paths, comment out the - /var/log/*.log file. This will prevent Filebeat from sending every .log in that directory to Logstash. Then add new entries for syslog and auth.log. It should look something like this when you're done:
...
paths:
- /var/log/auth.log
- /var/log/syslog
# - /var/log/*.log
...
Input_type: syslog
paths:
- /var/log/auth.log
- /var/log/syslog
# - /var/log/*.log
...
Input_type: syslog
Then find the line that specifies document_type:, uncomment it and change its value to "syslog". It should look like this after the modification:
...
document_type: syslog
...
document_type: syslog
...
This specifies that the logs in this prospector are of type syslog
Next, under the output section, find the line that says elasticsearch:, which indicates the Elasticsearch output section (which we are not going to use). Delete or comment out the entire Elasticsearch output section (up to the line that says #logstash:).
Find the commented out Logstash output section, indicated by the line that says #logstash:, and uncomment it by deleting the preceding #. In this section, uncomment the hosts: ["localhost:5044"] line. Change localhost to the private IP address (or hostname, if you went with that option) of your ELK server:
filebeat.yml excerpt 3 of 5
### Logstash as output
logstash:
# The Logstash hosts
hosts: ["ELK_server_private_IP:5044"]
logstash:
# The Logstash hosts
hosts: ["ELK_server_private_IP:5044"]
This configures Filebeat to connect to Logstash on your ELK Server at port 5044
And uncommand the file: and path: “/tmp/filebeat” present under ### File as Output
It looks like:
file:
#path -----
path: “/tmp/filebeat”
Save and quit.
Service filebeat restart
Service filebeat status
Check all the service are running
Then reboot your sysytem
Then goto your browser and enter the url localhost:5601
And create a timestamp
Now click the Discover link in the top navigation bar. By default, this will show you all of the log data over the last 15 minutes. You should see a histogram with log events, with log messages below:
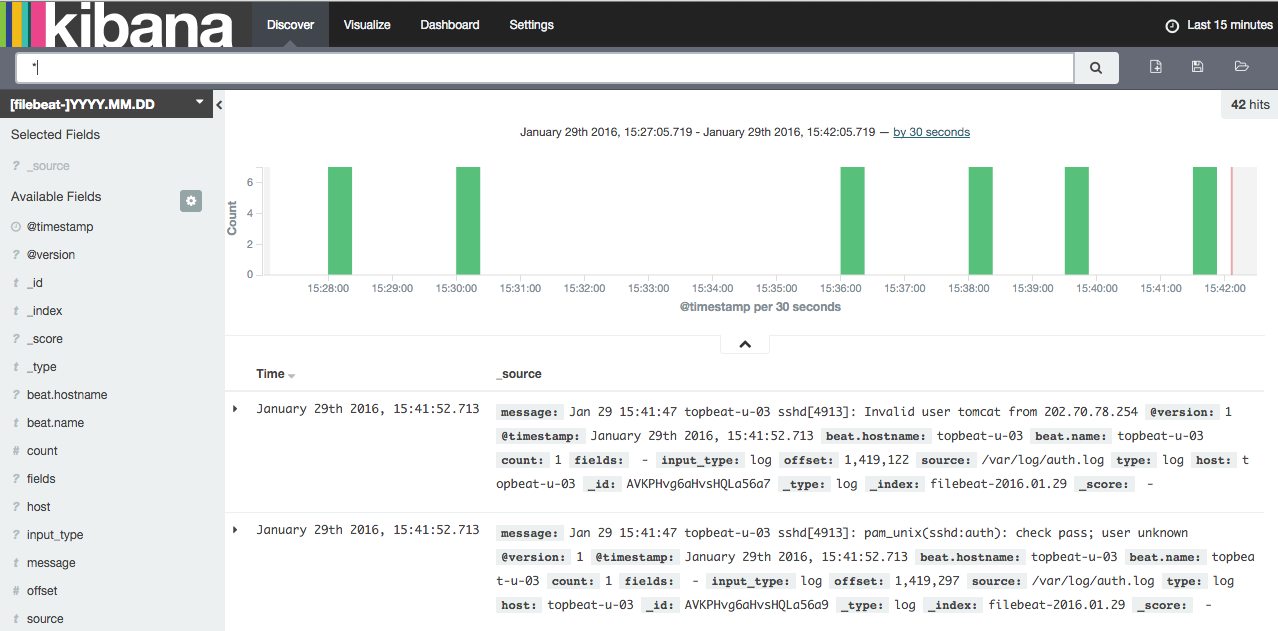
Right now, there won't be much in there because you are only gathering syslogs from your client servers. Here, you can search and browse through your logs. You can also customize your dashboard.
Reference :
Youtube links: In youtube the video is split into two
1:https://www.youtube.com/watch?v=61bGPqVVLHk
Website link:
Note:if you want to setup your ELK stack in centos,you can use the above website link,it contain both centos and ubuntu 14.04 version.


Comments
Post a Comment